Jon Kruger -
  • About Me
  • Blog
  • Values
  • Presentations
About Me
Blog
Values
Presentations
  • About Me
  • Blog
  • Values
  • Presentations
Jon Kruger
Agile, Iteration Management

Iteration Management – Post #14 – Keeping up

This post is a part of a series of posts about iteration management. If you want to start from the beginning, go here.

Iteration management tends to be very fast paced. I find this exciting, but at first it feels a little overwhelming. Several different analogies come to mind.

In the NFL, quarterbacks that come in to the league from college often have a hard time adjusting the pace of the pro game as opposed to what they were used to in college. Early on they tend to struggle, but as they get more experience, the game starts to “slow down” as they get used to the pace and they start to have more success.

When you try to ride waves in the ocean, you wait for the wave to come and then you start swimming as fast as you can with the wave to try and catch it. If you go too late, the wave will pass you by. If you go too early, the wave may pick you up, slam you into the ocean floor, and churn you around like you’re in a washing machine. But if you get it just right, it’s an exhilarating ride.

When you’re leading a team, there’s a lot to keep track of. You have to be able to juggle multiple things at one time, and things can get out of control very quickly. The trick is to try and keep everything in front of you, and as soon as you see things getting out of control, come up with a plan to address the issues and get things back on track.

If I had to boil all of the Agile practices and ideas down to one sentence, it would be this: Do more of what works, and less of what doesn’t. I don’t care if you do things “by the book” or not. All that matters is that you find the best way to be successful and keep trying to get better.

I think of Agile as a giant toolbox of practices, principles, and ideas that I can draw from to help me with whatever situation I’m dealing with. I follow many practices that are associated with agile methodologies, but most of the time I don’t think of our process as “doing Agile” anymore. Most people would say that we are “doing Agile”, but we’re just trying to apply common sense and creative thinking to find better ways to develop software.

I’m constantly trying to find new ways to improve the software development process. I hope that this series of blog posts have given you some good ideas for your toolbox that you can use to help your team be more successful.

April 20, 2015by Jon Kruger
Agile, Iteration Management

Iteration Management – Post #13 – Involving stakeholders

This post is a part of a series of posts about iteration management. If you want to start from the beginning, go here.

If I could pick one thing that will most impact whether your project will be successful, it would be how well you work with your stakeholders. I don’t know how many times I’ve heard people say that they key to their team’s success is the involvement of a good product owner from the business. As an iteration manager, your responsibilities might include working with stakeholders to involve them in the process.

Product owners

When I refer to a “product owner”, I’m talking about one person in the business who is the primary person to make decisions about the project. While you will likely get input from many people in the business, the product owner is the go-to person who will make decisions when people disagree and make sure that you are getting the information that you need.

What happens when you don’t have a good product owner? Any number of things.

  • Getting behind because you’re waiting for answers
  • Lack of detailed requirements
  • Lots of requirements changes due to people changing their mind
  • Getting conflicting messages from people in the business

That’s not to say that you won’t be successful if you don’t have a good product owner, but if you don’t have one, there are a lot more things that can go wrong.

Here’s what I tell management when we don’t have a defined product owner: requirements have to come from somewhere, and someone needs to answer questions, fill in the details, and settle disputes. That can either be someone in the business who has the knowledge and ability to make those decisions, or it can be people on the development team. I don’t know that you always want developers making decisions about how things should work, and I don’t think developers really want to do that either.

Often times I’ve seen a BA end up being the de facto product owner. If you have a good BA that really understands the business, this is probably your best choice if you can’t get someone from the business to step up. It’s still a risk that should be monitored and mentioned to the people who are paying for the project. You can write the best application in the world, but if you build the wrong thing, it was all a waste of time.

Iteration planning

If you’re working within the context of iterations, you’ll want to meet with people in the business before the iteration starts so that you can discuss the project and let them decide what you should work on. This is also a good time to ask clarification questions and make sure that you have everything that you’re going to need to do the next iteration’s work.

How you do this is up to you. Maybe you have a scheduled meeting before the iteration, or maybe you have a backlog of tickets that the business keeps prioritized. It really helps if you’ve estimated the work before you do this exercise so that everyone understands how what each feature is going to cost. Maybe they asked for something but when they realize how hard it is, they might decide that it’s not worth it anymore.

Even if you’re on a project where all or most of the work was scoped out before the project started, it’s still a good idea to have this meeting. Things are always changing, so the business might have different priorities now than they did a few months ago.

By letting your stakeholders choose what you work on, it involves them in the process and lets them have some skin in the game. If you’re not involving the stakeholders on a regular basis, they might assume that everything is going great when in reality the project might have all kinds of problems. At some point those problems are going to surface, and the sooner you can make people aware of them, the sooner you can work together on a solution to get things back on track.

Handling changes within the iteration

Even if you have short iterations, things are going to come up during the iteration and the business might want to change things mid-iteration. Some teams might find this annoying. I find it necessary. Successful businesses able to adapt quickly and respond to change quickly, but if IT is unable to keep up with the changes, then IT is keeping the business from being successful.

That’s why I welcome people asking if they can bring something new into the iteration – provided that they take an equal amount of work out and that they understand the impact of the change of focus (for example, if they want to remove something that is already half done, they should understand the impact of having the development team stop working on that feature). One of the reasons I like having a physical board instead of an online tool is that it’s much easier for business people to do this because they can just come over on their own and see what’s available to swap out for new work.

I love seeing this happen because it means that people in the business get it. I love when they come over and say, “We have this issue that just came up, can we swap out these two tickets for this new one?” I’m sure they love being able to have that level of control, and the development team can adapt to the change without having to get slammed with extra work.

Demos/user acceptance testing

Towards the end of the iteration, take some time to do a demo for your stakeholders and show them what you’ve been working on. This lets them know what you’ve been up to, and it also gives you (and them) a chance to make sure that you built the right thing. Maybe you even have some users try out the new functionality see if they’re able to do what they need to do. This feedback is essential because it’s so important that we build the right thing and that we build something is going to make the users’ life better.

How many times have you had an app on your phone that you really liked, but then a major update was released with UI changes that made the experience worse? I’ve had this happen multiple times with apps that I liked, and most times it led me to uninstall the updates or switch to another app altogether. You don’t want to do this to your users. It’s not about you or building what you want to build, it’s about what they want and what they need to do their job.

This stuff is important!

Your user base is hopefully very interested in seeing your project succeed, and if you can develop a good working relationship with people in the business, everyone will be happy in the end.

My current project has a very strong project owner. She is very involved in the process and is very in tune with everything that is going on, both on her team and the development team. She’s always willing to make decisions when the development team has questions and actively manages the backlog of work for future iterations. As a result, we’re able to get a lot of work done, and the users have been very happy with the outcome, and that might just be the most important part.


Read the next post in this series, Keeping up.

April 20, 2015by Jon Kruger
Agile, Iteration Management

Iteration Management – Post #12 – Capacity planning

This post is a part of a series of posts about iteration management. If you want to start from the beginning, go here.

The goal of capacity planning is to figure out how much work the team can get done in a given amount of time (usually an iteration). This will allow us to make sure we plan a reasonable amount of work for the iteration, and it will help us make a commitment to the business and actually keep the commitment.

It’s important to remember that we need to have a good reason for everything that we do, and we need to understand why we do it so that so that we only do the things that provide value. I feel that when people are afraid to try Agile, they are afraid of having to adopt a prescriptive process that dictates that they must do something in a way that is not the best way for their team. If we don’t know why we need to do something, we need to figure out why or start questioning whether it’s worth it.

The ultimate goal of most teams is to deliver working software, and to do it in a timely manner. The goal is not to cram in as much as possible, the goal is to move things through the system as fast as possible. We ultimately want to decrease the time between the time when a stakeholder thinks of an idea and the time when it’s live in production.

We also want to be able to predictably deliver software. Sure, your superior likes it when you get things done quickly, but if you make overly ambitious promises but then keep having to push release dates back, it doesn’t look good. This is where capacity planning comes in — we want to figure out how much we can realistically get done in a given period of time.

In order to do this accurately, you need to get really good at data analysis. This doesn’t mean that you need to go take a class in statistics, but it’s in your best interest to collect data and use it to your advantage. I can’t tell you how many times I’ve made an assumption about something related to software development and how long it takes, only to find out that I was way wrong once I looked at the data. That could be the difference in your project succeeding or failing.

Small

The magic word when it comes to capacity planning is small. Capacity planning gets easier as the tickets get smaller, the iteration length gets smaller, and the team size gets smaller. Remember that as we go through the rest of this.

Anyone who has ever tried to plan future work for a team of 10+ people will know what I’m talking about. It is possible and sometimes you get it right, but if your planning is off for even a couple weeks, you can waste a lot of time and money before you know it. But planning for two people? That’s much easier and your chance of being accurate is much higher.

Things to consider

Here are some things that I like to consider when doing capacity planning.

What the stakeholders want

This is obvious, right? When I say “stakeholders”, that could be “the business” or your user base (if you’re building/selling a product), or whoever is going to use the software that you’re going to build. What do they care about?

The word “stakeholders” implies that they have a stake in the game. So the first step should be to talk to whoever the stakeholders are and let them choose what you work on during the next iteration.

Keep in mind, that there could be multiple stakeholders, and they could include your manager, other teams, or your team. You might have technical debt that you really need to pay off.

Expected time off

Does anyone on the team have vacation coming up? Is anyone going to training for a day or two? Is there a 3 hour meeting coming up about health insurance benefits that everyone is going to attend? All of these factor into how much time each person has to spend each iteration.

Utilization %

What percentage of each person’s time is spent on working towards completing tickets? No one spends 100% of their time working on tickets. We all have meetings, bathroom breaks, hallway conversations, and other things that don’t directly contribute towards moving tickets (however important they might be). I want to minimize the amount of this untracked time. Obviously, you want your people working on the task at hand instead of whatever distractions might come up, but I also want people to be creating tickets for things that come up during the iteration so that I can get a better picture of what goes on during an iteration (more on this later in the post).

Also, many people on the team, whether they notice or not, may perform multiple different functions. You might have a developer that does some testing, a QA person that does some analysis, and so on. So I don’t just want to know the percentage of time that goes towards moving tickets, I want to know the percentage of time spent on analysis, development, testing, and project/iteration management.

Normal working hours

Most employers assume a 40 hour work week, but that doesn’t mean that everyone works that. We’ve all worked with that person who puts 40 hours on their timesheet but works 50 hours. I’m sure employers and managers appreciate that person going the extra mile, but this really skews the capacity plan. If you use past iterations’ results as an indicator to help you predict how much work you can get done given a number of available hours, now you’re making assumptions off of data that isn’t accurate. What happens when the “dedicated” worker goes on vacation, or has something come up in his or her life and now they can’t work 50 hours anymore? You’re going to come up short.

I’m a big believer in sustainable pace and the idea that if we figure out how to work smarter in a reasonable amount of hours, we will outsmart and outpace the people who just throw more hours at a problem. I think of team members like washing machines — they work great, but if you put too much into it, everything they do needs to be redone. And of course, I want people on the team to have a good work/life balance. I want them to work hard, but I want them to enjoy their work and their life outside of work.

If you do have that person who wants to work extra hours for whatever reason, the important thing when it comes to capacity planning is that you’re aware of how much everyone is working so that you can factor that into your analysis. This means telling that guy who is working 50 hours to actually put 50 hours on his timesheet so that time doesn’t get lost for planning purposes.

Work coming into the iteration

This is a big one. This can come from some obvious sources, such as production support, bugs found during the iteration, or new work that gets “discovered” when you realize that a certain feature needs some other things to be done in order for it to work. It can also come from less obvious sources, such as impromptu email requests for help, adhoc query help, or time spent having to help someone on another team. You want to track all of this.

I’ve started becoming ridiculously meticulous about this. You might think that it’s no big deal if you spend 1 hour writing an adhoc query for your boss and not creating a ticket for it, but now you have unaccounted for time where you were working on something and you don’t have a record of it. I’ve started creating tickets for this sort of thing when these come up just so that I can have a record of the time that I spent doing that task.

When I’m doing capacity planning, I run queries to find out how what tickets were completed in the previous iteration that were created after the start of the previous iteration and I total up the number of hours/points that were in those tickets. Over time, you will start to see a trend that will help you predict approximately how much work you need to account for that you don’t know about yet.

Getting this right can really be a life saver. Last year, the project I was on was constantly falling short of their iteration commitments and we kept having to push tickets out to the next iteration. This was frustrating people in the business because they didn’t actually know when things would get done, and they couldn’t do their own planning because they couldn’t count on us to deliver. When we started adding up the hours spent on work that came into the iteration, it was pretty clear why we weren’t able to get all of the work done — because we had other things come up that were deemed to be more important.

Agile people will tell you that work coming into the iteration is OK because the business can choose to swap out items for more important tickets at any time. This is true, but too often the work that comes into the iteration is a production issue or high priority item for someone in the business and this will negatively impact other people whose tickets get moved out (whether they like it not). There’s always going to be some amount of this, but I would rather try to minimize it by expecting the unexpected up front.

Multiple projects

In many cases, one team might be responsible for different projects of kinds of work. A common example is when one team handles both maintenance/production support and new features. If you have any division of work on your team, then you need to track time at the same level. For example, let’s say that you have 2 people working on production support and maintenance and 4 people working on new features. You’re basically doing 2 mini-capacity plans for 2 mini-teams at this point. This is actually a really good thing, because like I said before, the smaller the team size, the easier it is to plan.

Analysis and testing

A common trap that managers fall into is thinking that there is a linear correlation between number of developers and the amount of work that gets done. If you have two developers working on a project and you add a third, you aren’t necessarily going to get 50% more done because someone has to analyze and test that work. When you’re estimating tickets, make sure you also get estimates for the analysis and testing! This can be especially hard for business analysts because analysis is sometimes a somewhat nebulous activity that involves meetings, reading, writing requirements, and any number of other activities. Some estimate is better than no estimate, and this in the best interest of the person whose time is being estimated, otherwise they could end up with way too much work to do in not enough time, and that’s not good for anybody.

Another common trap is not leaving enough time to adequately test the work that is being done. The definition of “adequate testing” can vary widely, and depending on the situation, you might want to do more or less testing. But too often testing gets ignored and people only look at the development estimates when they do their planning (and remember, if you develop something on the last day of the iteration, you probably won’t have time to test it). Your definition of done should include testing, not just development. Remember, we are trying to figure out how much work we can complete in an iteration, not just write code for.

Past performance

Is the team consistenly over-committing (or under-committing)? Do you notice that someone on the team consistently over-estimates how much work they can get done each iteration? No one estimates correctly 100% of the time, and usually people tend to consistenly over-estimate or (more likely) under-estimate. Over time, your data will begin to paint a picture for you so that you can make the necessary adjustments.

Team consistency

Analyzing past performance is much easier if the team remains consistent. If you are adding or removing team members or if your team members can randomly get pulled off to work on other projects, your data from past iterations won’t be applicable and you’ll be a lot closer to flying blind.

You’ll be much better off by keeping teams intact and bringing work to teams. It’s OK to have one team responsible for multiple projects because you’ll do one capacity plan that covers all of them. But if the makeup of the team itself is changing, you’re job is going to very difficult. Teams tend to work better when they work with the same people over a longer period of time (not to mention it’s good for morale).

Gut feel estimates

So what if you have all of this data, how do you actually come up with a number of tickets/points/hours that a team can complete in the next iteration? Some people might advocate taking the average velocity over a significant period of time and using that as the estimate. If you feel that you velocity data is steady and reliable enough, then maybe that works for you. More often than not, that hasn’t been the case for me.

If your velocity data isn’t giving you an obvious answer, there are alternatives. If I’ve been on a project for long enough and I feel like I have a good grasp of things, then I might take a gut feel estimate of how much we can get done (velocity), but I’m also going to take a gut feel estimate of other factors, like amount of work coming into the iteration, % of time people spend moving tickets, % of time spent on analysis vs. development vs. testing, etc. Then at the end of the iteration, I can adjust my velocity estimate based on how accurate I was both on the large-scale estimate and the estimate I had for smaller, more measurable data points. Over time, my “gut feel” will become less of a gut feel and more based on several data points. I like this approach because I feel that it gets me to accurate capacity planning faster than relying on velocity, which we know can vary based on lots of factors.

The end result

Ultimately we want to come up with a list of features that we can commit to getting done in an iteration. Obviously everything is subject to change, but the more confidence we have in being able to complete what we’ve committed to, the better. Everything that I’ve talked about in this post to this point all points towards this goal, but the process to get there can be quite complicated. Over time, your team should be able to deliver quality work in a predictable manner, which makes everyone happy.


Read the next post in this series, Involving stakeholders.

April 15, 2015by Jon Kruger
Agile, Iteration Management

Iteration Management – Post #11 – Burndown charts

This post is a part of a series of posts about iteration management. If you want to start from the beginning, go here.

In my last post, I talked about metrics and how they can positively and negatively affect your project. In this post, I wanted to focus specifically on burndown charts.

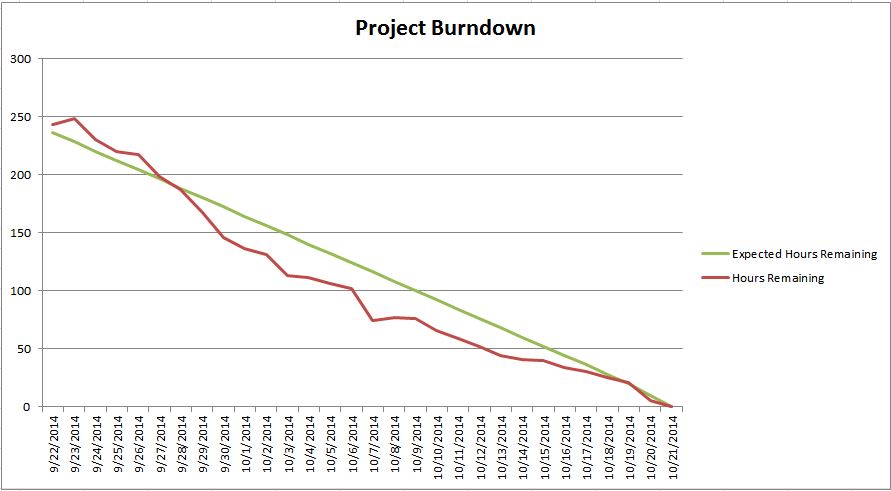
Burndown charts are a commonly used way to show the progress of a project. Here is a really basic burndown:
simple burndown

The green line shows the expected progress of the project. The line starts with the total amount of scope (measured in hours, points, # of tickets, etc.) and draws a line to the planned completion date. The red line shows the actual progress of the project over time. This is an easy and effective way to see if we’re ahead or behind and when we have large increases or decreases in the amount of scope, among other things. The x-axis of the chart can be measured in days, weeks, iterations, or however often you want to measure the progress.

People often show other data on burndowns as well. For example:

  • Total scope
  • Total work completed (“burn-up”)
  • Work completed each iteration (velocity)
  • Expected total scope (if you expect a significant amount of work to be added over time)
  • Notes about significant events

Here are some burndowns that I’ve used over time.

Project level burndowns vs. iteration level burndowns

You can use burndowns to track the progress of a project over multiple iterations, but some people also use burndowns to track progress of work in a given iteration. In this post is going to focus primarily on project-level burndowns.

Learning experiences

Here are some burndowns that I’ve used in the past. I call these “learning experiences” because some worked better than others.
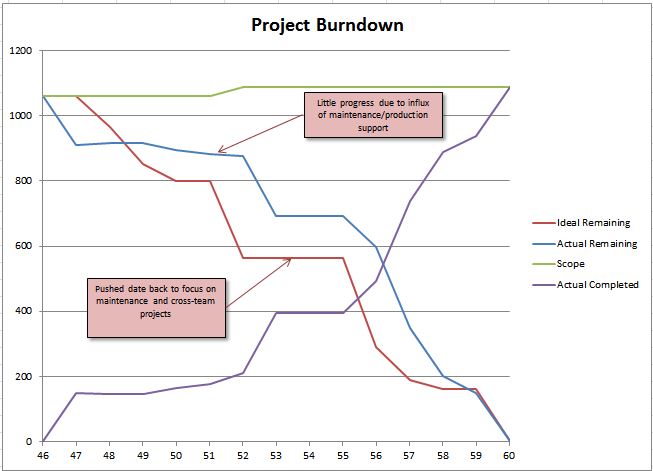
burndown

There are some interesting things going on here. First of all, the red line represents “Ideal Remaining Work” and instead of this being a straight line, it’s quite jagged. On this project (and many projects), the number of people focusing on the project was going to change over time. For a couple iterations, it was going to be one business analyst working on the project. Eventually we added in a few devs and testers, then didn’t have much work for an iteration or two (waiting for other teams to do their part, but no work for us). Then in the last iteration we completed a bunch of work that had to be done at the last minute. A straight downward line would not have reflected this schedule, so I made the red line reflect what we were planning for.

There were also a few hiccups along the way that pulled our focus from the project and made us focus on other things. Since we adjusted our plan, I adjusted the burndown accordingly and added some notes to explain what happened. One of my main points in my last post about metrics was that you have to be careful about people misinterpreting raw data from burndown charts, which is where the callouts come in handy.

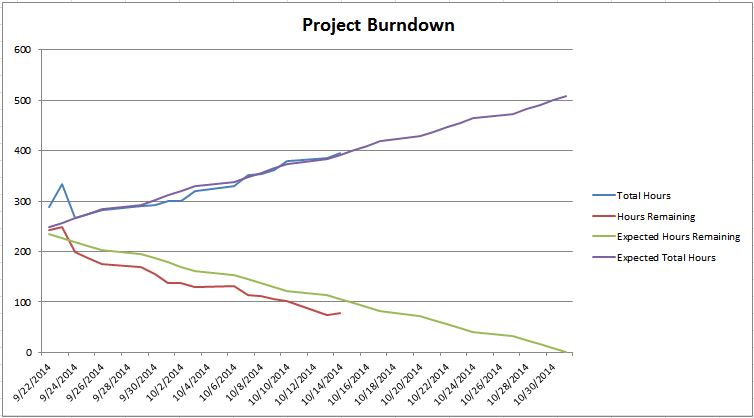
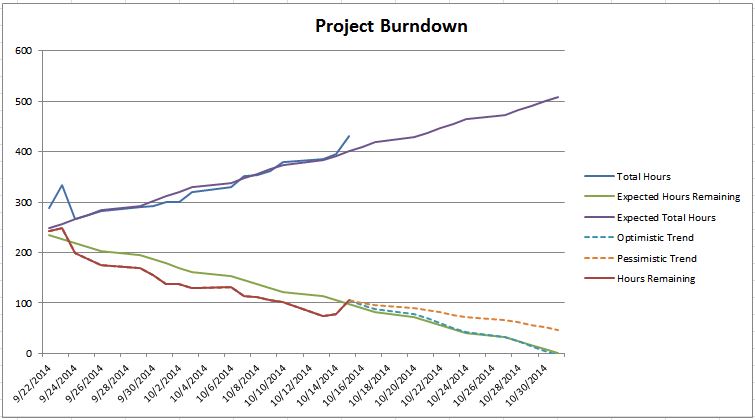
This is the burndown from the last post. On this project, we had some scope defined but we also knew that there was going to be a significant amount of more scope that we would uncover along the way. So I added an “Expected Total Hours” line that projected the scope increases over time (we based this line on the amount of scope increases from our previous project which was very similar to this one). The “Total Hours” line showed the total actual scope over time. As you can see, we were extremely accurate on the scope increases over time (because we tracked everything that we could and based our estimates on past data).

As I mentioned in that post, on this project the burndown was showing that we were ahead, but I knew that things had gone smoother than expected and as soon as we hit one bump in the road we would be behind. When you look at this chart, it’s really tempting to see a trend in the “Hours Remaining” line and visualize that heading down towards an early completion date. I felt that this was optimistic, but that’s the message that the burndown was sending.

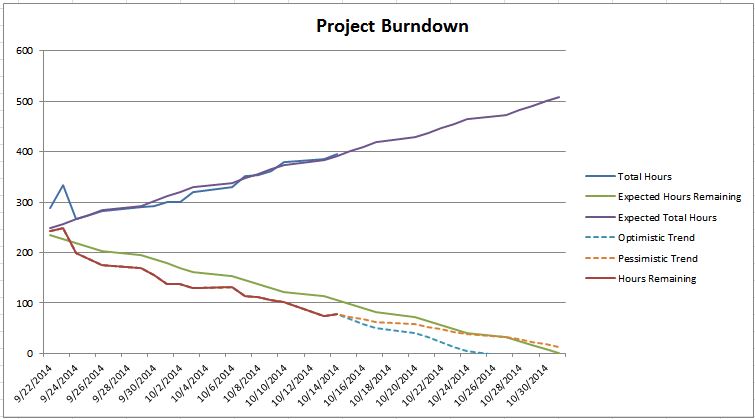
In reality, this was more accurate:
burndown

Here I added two more lines that showed that you would end up at different result depending on whether things were to go well or go poorly. The closer you get to the release date, the more certain you become of the result, but when you’re farther away, lots can change. This more accurately reflects that there was good chance of finishing on time, but there was still a risk of not making it.

Lo and behold, this happened the next day.
burndown

BOOM! The bump in the road that I expected happened. Suddenly things weren’t so rosy. In fact it didn’t look good at all. Thanks to my burndown chart, I (and everyone else that cared) immediately knew about it. Now look at my chances of finishing on time — not so good.

The learning experience here is that if I had had the dotted lines earlier showing the potential range of finishing points, I probably would’ve been able to show earlier that the project was at risk.

(Side note: this post is from awhile ago but it illustrates the same concept with some other cool ideas.)

Should you post a burndown chart?

I’ve had a lot of learning experiences with burndown charts, but the main takeaway is that you have to be careful posting charts and data that leave the interpretation up to the person who is looking at it. In my opinion, if someone misinterprets a burndown chart, that’s a lot worse than them not being able to see the burndown at all, because now they think they know the status of the project when what they think they know isn’t the truth. Not only that, you won’t necessarily know that they made an incorrect interpretation.

Because of this, I would be careful about sharing a burndown chart with others. I’m all for sharing information about a project with others, especially management. But I want to know exactly what it is that they want to know and then figure out the best way to communicate to them. Maybe that’s with a burndown chart (potentially with lots of callouts and accompanying explanations). But it might also be an email or a meeting where I use red/yellow/green indicators to indicate whether I think we’re on track, or maybe I just have a conversation.

I think creating a burndown and collecting all of the data needed to create it are invaluable, but that doesn’t mean that you need to publicize that information. You should certainly use the information to help with your own planning.


Read the next post in this series, Capacity planning.

April 9, 2015by Jon Kruger
Agile, Iteration Management

Iteration Management – Post #10 – Metrics

This post is a part of a series of posts about iteration management. If you want to start from the beginning, go here.

In a previous post, I talked about data analysis and how you can use data to help you plan and estimate better. Now let’s talk about what specific things we can track and what we should do with it.

Types of metrics

I have to separate metrics into two categories – metrics that stay within the team and metrics that I share with others. The tricky thing about data is that data has no value on its own, the value is in the interpretation of the data. When I share data and metrics with people outside the team, I want to make sure that either I’m presenting the interpretation of the data or I’m presenting the data in a way that others will be able to interpret it correctly.

I can’t emphasize this enough. The worst thing that can happen is that you present raw data and people interpret it the wrong way. Also, if you present data without interpretation, people on your team will think about how others will interpret the data and change their behavior so that things will be interpreted in a way that makes them look good.

Interpretation, not just data

Management likes metrics. They realize that we can learn a lot from data and that it can give them an idea of how a project is going. They might not say it, but what they really want isn’t the data, it’s the interpretation (based on the data) that has real value for them.

A great example of this is burndown charts. Here’s a burndown chart from a project I was on:

You can take two very different interpretations from this burndown:
1) The project is ahead of schedule and everything is OK
2) The project is at risk because we aren’t that far ahead of schedule and things have been going surprisingly smooth, and as soon as we run into any hiccups, we might not be done in time

The problem is that I presented data without interpretation and allowed it be interpreted by management. I find that managers can tend to be overly optimistic with their interpretation of data (especially when it comes to timelines). But there are things that I knew about the project that either weren’t reflected on the burndown or weren’t very clear:

  • We were only about 20 hours ahead of schedule, which for this 2 person team equated to about 2 days.
  • The timeline on this project was somewhat optimistic, with the assumption that we would try to control scope increases as much as possible, but on past projects we had run into unavoidable scope increases. This project hadn’t had any of those hiccups yet, but the fact that that hadn’t happened was unexpected.

As you can guess, management went with interpretation #1, while I felt the truth was interpretation #2. The problem was that I didn’t understand how they would interpret the data and I didn’t present it correctly.

How would I do this differently? Well, I’ll get more into burndowns in a later post. But I would include my interpretation along with the burndown, even if it’s something as simple as a red/yellow/green indicator to let them know how I feel about the project, risks/problems we might be having, or even just a conversation about how I feel about things.

Internal metrics

Internal metrics are things that I’m going to track to help me estimate and plan for future iterations, but I’m not necessarily going to publish this information for anyone to see (or maybe I just share it with the team, but not outside the team).

As far as internal metrics, what kind of stuff do I track? Well, it depends on the team and the situation, but here are some things:

  • Estimates vs. actuals at the feature level (you can do this whether you estimate in hours or story points)
  • Points/hours planned for vs. points/hours completed in an iteration
  • Points/hours completed in an iteration (velocity)
  • How long it takes for a work item to get from the time the business tells us to work on it to the time that it’s ready to go to production (cycle time – I say “ready to go to production” because sometimes you have the work completed, but you don’t send it to production immediately for various reasons)
  • Work that comes into the iteration after the iteration starts
  • How much work gets pushed out of the iteration
  • Number of hours worked over 40 hours per week
  • Percentage of time spent on analysis, development, testing, and everything else
  • User happiness (this one obviously going to be backed up with data necessarily, but if the users aren’t happy, I don’t know that we’re succeeding)

You can collect all of this data, but the value is in how you interpret it, of course!

Velocity

A popular metric is velocity, but I’ve found that in order to be able to infer anything from the velocity data, I need to collect the data over a long period of time where almost everything in the work environment is consistent. That means that the team members don’t change, people don’t take long vacations, the team is doing similar kinds of work over that time period, and any number of things that are often very difficult to control (not to mention that the team might try to game the system to make the velocity numbers look good). Also, I don’t care about velocity as much as I care about capacity, or how much work we can get done in an iteration.

I’ve started taking a different approach to calculating capacity. Instead of using velocity (which in my opinion isn’t statistically significant enough), I like to take a gut feel estimate of how much I think the team can get done (which can somewhat be based on velocity data). I will also make estimates for other metrics that are easier to calculate, and then when I see that those metrics are off, I will adjust the velocity estimate accordingly.

For example, all of these metrics are easy to calculate and affect velocity and capacity:

  • Estimates vs. actuals at the feature level (you can do this whether you estimate in hours or story points)
  • Work that comes into the iteration after the iteration starts (excluding even swaps of one feature for another) – for example, this could be bugs, production support, etc.
  • Percentage of time spent on analysis, development, testing, and everything else
  • Points/hours planned for vs. points/hours completed in an iteration
  • Planned vacations, holidays, or other unusual events

If I see that my estimates for these data points are off, then I can adjust them accordingly and also adjust my capacity estimates up or down. Over time, my capacity estimates should get better and better as I learn more, and I’m basing the number off of data points that are easy to collect and aren’t affected by so many variables. So in a way, I’m calculating the velocity of the team by backing into it.

Again, I’ve categorized velocity as an internal metric. Velocity is too raw of a data point to share with management in my opinion, because then you open yourself up to them wondering why one iteration had lower velocity than another and that sort of thing. I’d rather share my capacity numbers (which are interpreted from data by me) with management so that we can plan for the iteration and future iterations. My interpreted capacity estimate is going to be more accurate, and by doing this I have much more control over the message that I’m sending to management about the project.

External metrics

I really don’t have anything to list here, because it all depends on what your management wants to see. The key is to ask them to give you the questions they want answered, and then you come up with a way to answer those questions. That might be in the form of a chart, bullet points with red/yellow/green categorization, a conversation, or whatever makes them feel comfortable. Either way, I want to find a way that will help them easily and accurately see the state of the project.

You have to very careful in what you publicize. Many people (and I’ve done this in the past) will post velocity charts on the wall for everyone to see. Some people might say that this could motivate the team to try and get things done faster. In my opinion, all this is going to do is distract the team from the goal of delivering quality, working software. Now they might try to game the system to produce more velocity, maybe at the expense of writing tests, having design discussions with the team, working with the users to get it right, etc. I would much rather motivate people by showing them how the project they’re working on is going to have a huge impact for the business or the user base. When someone comes to me and paints that picture, man, I want to get the project done tomorrow because I see the impact that it’s going to have.

Bad metrics

There are certain metrics that I try to avoid, and this includes anything that could potentially influence anyone on the team to change their goals away from what they should be. For example, avoid any metrics that measure and compare individual team members. I don’t even want people to know that I’m collecting this information, because they will assume that anything that you are collecting might be getting shared with management or people outside the team. I know that some developers on the team are faster than others, and if these people report to you, then you might want to compare their performance with others. But you have to be very careful about it. The worst thing you can have happen is that team members stop trying to help other people on the team and only focus on getting their work done. This does not create a healthy work environment at all.

Implied metrics

Just because you don’t post a chart with numbers doesn’t mean that something that you’re doing can’t be interpreted as implied metrics. I’ve seen this happen with agile card walls. For example:

  • Does your card wall make it easy to compare developers’ productivity levels?
  • Does your card wall incentivize developers just getting a ticket to QA vs. getting a ticket developed and tested?

Agile card walls offer up lots of raw data that can be interpreted. This is a really good thing and it’s the reason that we use them. But you have to careful about how people might interpret would they say. There’s nothing wrong with using some sort of method to show who is working on what, but everything that you interpret from what you see on the board should be about how the team is doing, not how individuals are doing. If the board incentivizes people to work as a team, then they’re more likely to do that. But if it incentivizes people to work for themselves, then that’s what they’ll do.

Metrics are tricky!

Collecting metrics is a difficult task, and often you have to walk the line between providing helpful, meaningful interpretations of data and giving people another way to get the wrong impression about the situation. This takes a lot of intuition and understanding of how the people around you think, work, and interpret situations. But if you can collect good metrics, they will start you down the path to predictable delivery.


Read the next post in this series, Burndown charts.

March 25, 2015by Jon Kruger
Agile, Iteration Management

Iteration Management – Post #9 – Personal iteration planning

This post is a part of a series of posts about iteration management. If you want to start from the beginning, go here.

Let’s take a break from our team-based planning talk about talk about you. Good planning starts with you and your ability to accurately track and plan for how you spend your own time. This will in turn help the team plan because you’re able to give the team a better idea of what you’ll be able to accomplish.

Track everything you do

Let’s be honest — tracking time isn’t really that much fun. We’ll do almost any menial task before we enter our time in a time tracking tool. Let’s put aside all of the accounting benefits of tracking your time (which is real money). Your success will be affected by how well you track how you spend your time.

I started tracking my time because I was doing consulting and I wanted to be ready in case someone came to me and questioned how I was spending my time. Then I started to see that I had a lot of meaningful data that I could use for my own benefit. I was able to look back and see how much time I spent on each project, on each work item, and how much time I spent doing development vs. analysis vs. testing vs. production support vs. project management vs. everything else.

You can track this information however you want, but I prefer Excel because I can set it up however I want and it’s easy to view, filter and aggregate past data.

time
(click for a larger, more readable image)

This is really valuable data. If someone comes up to you and asks you how much work you’ll be able to get done next iteration, you’ll want to know how much time you typically can spend doing various activities. Often times they don’t ask you, but there’s an assumption of how much time people spend working on tickets. But if they’re assuming that you can spend 80% working on tickets but you actually only spend 70%, that’s 8 hours over 2 weeks that they think you have that you actually don’t have. Not only that, if you can back up your number with actual data, that’s a lot harder to argue with.

Invisible time

If you’re not tracking your time, you might have a lot of what I call “invisible time”. Invisible time is time that you spend doing something, but you aren’t tracking it and you don’t know where the time went. This is dangerous because you can actually end up having a lot of invisible time.

We all have random things to do that come up and keep us from working on our tasks that we have to do. This could be answering emails, hallway conversations, researching production support issues, or whatever else that might come up. Usually there aren’t tickets for these sort of things. I’m not saying that these activities are bad, but I want to know about them so that I can see if it’s getting out of hand.

I’m reasonable about this — I don’t write down that I spent 5 minutes answering an email — but if I spend 30 minutes or more doing something, I’m going to record that. I might even create a work item for it if that makes sense, because now other people will know that I did it and how much time I spent doing it.

Create tickets

I like to create tickets for everything I do when it makes sense to do so. This helps me cut down on the invisible time by making it visible to everyone. Having a record of work done in a work item tracking tool helps everyone plan better because it makes things visible to the people doing the planning. Maybe you’re getting inundated with production support requests and random analysis requests. Having work items for these sorts of things helps people see just how inundated you actually are and shows people what you’re spending your time on. However you do it, the point is that we want visibility into where our time goes.

Compare estimates vs. actuals

How accurate are your estimates? Do you have any idea? If you’re tracking the time you spend on a work item, you can compare the actual amount of time spent with the estimate that you gave, and this can help you get better at estimating.

Like many people, I’ve tended to underestimate tasks in the past. This was because when I thought of an estimate, I would typically think about how long it would take for me to get to a point where someone else could test the feature (after I did my testing, of course). But I found that I usually wasn’t accounting for time spent fixing bugs that the testers found, or even looking into questions that testers had about things that they thought were bugs that weren’t actually bugs. Once I started comparing my estimates, I was able to see what I was missing and start estimating better.

Protect your time

Let’s say that the people doing the planning come to me and ask me how much time I can spend working on development tickets in an iteration, and let’s say that I say 70%. While this is technically an estimate, in a way I’m making a commitment to them to try and spend at least 70% of my time working on tickets.

So what happens when your schedule starts to fill up with meetings? Maybe these meetings are coming from people outside your team.

My commitment is to my team first, and everyone else second. If that’s true, then I need to proactively manage my calendar so that it doesn’t get so full with meetings that I can’t meet my commitments.

When I’ve committed to working tickets, I’m going to block off my calendar for the rest of a day if that day gets more than half full with meetings. Those meetings can wait while I finish meeting the commitments I made to the people that are most important to me.

I’m able to be proactive with my calendar because I decided how I needed to spend my time ahead of time. Whether someone else asks to know this information or not, I can still come up with an estimate for myself so that I can try to hit my personal targets. Then next iteration I can adjust my estimates based on how things went in the previous iteration.

Trust me, it’s worth it

While this seems tedious and boring, I’ve found this information to be extremely valuable and it actually doesn’t take much effort to do it (especially once you get in the habit). As a professional, I want to have as much information so that I can make the best use of my time.


Read the next post in this series, Metrics.

March 20, 2015by Jon Kruger
Agile, Iteration Management

Iteration Management – Post #8 – Consistency

This post is a part of a series of posts about iteration management. If you want to start from the beginning, go here.

If your team has a lot of periods of crunch time and if overtime happens on a somewhat regular basis, it becomes really difficult to know what is normal anymore. Far too often, the crunch time ends up becoming the norm because your good, diligent, dedicated workers will want to step up to the challenge and hit a date without complaining. But since management sees that you hit the date and things seem to go well with minimal complaining, they might think that it’s no problem if the same thing happens again. So what do you do now, plan for people to work 40 hour weeks or 50 hour weeks? Or maybe the number of hours worked changes from week to week. This is a good way to kill morale, and it also makes it really difficult to collect any meaningful data that you can use to help with planning.

Another problem happens when people on your team work more than 40 hours but only report 40 hours on their timesheet. Now you’re collecting data that is incorrect, which is going to make you underestimate how much you can get done. I realize that most full time employees get paid a salary and don’t get paid extra for hours worked above 40, but people need to be honest about how much their working.

This is a tricky situation, because some people like working extra hours. They want to do it because it’s fun. But there are other people that feel like they can’t do a good enough job by just working normal hours. You’re going to have people that feel inadequate, but I like to find those people and let them know that they don’t need to sacrifice themselves like that just to fit in. If people feel stressed or that they can’t keep up, they’re not going to feel good about their work, they’ll be tempted to cut corners, and they won’t do their best work. I don’t want people to come to work and take it easy and not work hard, but I want their experience at work to be a positive thing in their life.

All of this makes data analysis really hard. What do you do with the person who works 60 hours a week for fun? I don’t want to tell them that they can’t do that (which I can’t really do), but it puts you in a tricky spot when they decide that they can’t work 60 hour weeks anymore and you’ve gotten used to (and planned for) that happening. Or maybe someone is frequently underestimating tickets to make themselves not look bad, but then working extra hours to get it done?

The answer is… I don’t know. Every situation is different, you’re just going to have to figure it out. I’m just pointing out some issues that can come up.

What we can do is try and create a positive work environment. We should try to create a culture of empowerment instead of a culture dominated by top-down command-and-control management. We should try to encourage and reaffirm the people on our team and help them avoid the impostor syndrome. We should try to improve the lives of the people on the team, which will also affect their performance at work in a positive way.


Read the next post in this series, Personal iteration planning.

March 11, 2015by Jon Kruger
Agile, Iteration Management

Iteration Management – Post #7 – Data Analysis

This post is a part of a series of posts about iteration management. If you want to start from the beginning, go here.

In order to get really good at planning, you need to get really good at data analysis. You need to collect all the data that you can and use it to prove your assumptions and accurately plan future work based on past results. The key word in that sentence is accurately – if you come up with a plan that isn’t accurate, that’s not going to be much better than no plan at all.

Here are some ways that data analysis has bailed me out in the past:

  • I was working for a consulting company and we were doing a project with two phases. We started on the first phase, and when that wrapped up, we were going to bid on the second phase. We had estimated the work for both phases, but the project manager wanted to know how accurate the estimates were, so he had all of the developers track and record the actual amount of time they spent on each work item. We found that we were underestimating everything by 20%. If we hadn’t realized that we were underestimating, we would’ve underbid the second phase of the project by 20%. If you do the math, that comes out to a lot of money we could’ve lost and a lot of extra hours worked.
  • On a recent project, we thought we had enough time to get the work done by the deadline, but when we analyzed how long the work would take combined with the expected amount of scope increase that we expected based on past releases, we were able to predict that we weren’t going to be able to make the release date with the current scope and team, 5 weeks before the release date (the project was only a 2 month project).
  • On the same project, we were actually ahead of schedule at one point, but we could see that the project had very few road bumps compared to past iterations so we were able to explain that while we were ahead of schedule, we still felt that the project was at risk.
  • When planning for an iteration, I was able to see that exactly how much time I had been spending on analysis vs. development so that I didn’t over-commit to development work when I really was spending more time doing analysis.

Let me give you an example. Have you ever played the game where you have a jar of jellybeans and you have to guess the number of jellybeans in the jar? Pretty hard to do right? (I’ve never won that game.) What if someone gave you several other jars of jellybeans of different sizes and told you how many jellybeans were in those jars? It would get a lot easier to estimate the number of jellybeans in the first jar, wouldn’t it? What made it easier? You based your estimate off of actual data from similar situations.

Estimates

We like to say that estimates are always wrong. Why are estimates wrong? Because there are too many variables that we don’t know enough about in order to make a correct prediction of what will happen. What if we could reduce those variables, either by controlling the environment or learning more about an activity using past data? As you bring more things under your control, you can become much more accurate with your estimates and your delivery cadence can become much more predictable.

Also, most teams estimate development work, but teams don’t always estimate analysis and testing work. Why not? Are those disciplines any less important than development? (The answer’s no.) Your BAs and testers should give estimates on tickets just like developers do, and those estimates should be used in the planning process.

Let’s look at some of the variables that we can control.

Team members

In order to be able to use past data to help predict the future, you need the team to remain the same for a period of time so that you can begin to see the trend. This means that you try to limit changes to the makeup of the team, and you should not have team members that are only partially dedicated to working on the team. If these things are in flux, it’s going to be a lot harder to use past data to predict future performance.

Consistent hours

I turned this point into its own post.

Smaller teams

Any planning is easier to do when you have fewer people to plan for. It’s shouldn’t be any surprise that the most accurate planning I’ve done is for teams of 1 or 2 people. If you reduce the number of variables (and people are always variable), you can be remarkably more accurate.

Many of you probably have a team that is larger than just two people, but you can still divide a large team into smaller sub-teams. Remember, every time you add a person to a team, you make it a little less efficient. You add one more variable to the system, one more person that needs to be kept in the loop.

Expecting the unexpected

What’s harder that planning for the work that you know about? Planning for the work that you don’t know about. This could be unexpected production support issues, scope increase, or bugs that come up during the iteration that increase the amount of work needed to complete a feature. However it happens, it happens all the time, and it often happens in relatively predictable amounts. Occasionally you’ll have that really bad week where everything comes to a halt because of serious production issues. But over time, you’ll begin to see a trend of how much of this kind of stuff happens, and you can plan for it.

Track everything

The more data you track, the more you will learn. This may seem tedious to your team (for whatever reason, there’s nothing developers hate more than tracking their time), but it’s really important. There’s actually a lot it for them. For example, if a developer thinks that they spend 80% of their time doing development each iteration but they actually spend 60%, they’re always going to be over-committing. Maybe they consistently underestimate their features (this happens a lot). If they’re being held accountable for getting work done, then they should want to estimate accurately.

Knowledge is power, and data analysis can give you the knowledge that you need to become a better planner and estimator. Next time we’ll talk about what kinds of things to track and what kinds of things to not track.


Read the next post in this series, Consistency.

March 11, 2015by Jon Kruger
Agile, Iteration Management

Iteration Management – Post #6 – Comparing estimation methods

This post is a part of a series of posts about iteration management. If you want to start from the beginning, go here.

Some teams like to estimate in hours, and other teams like to estimate in “story points”. Other people simply try to break down all work into small tickets and just count the number of tickets completed. Other people don’t estimate at all. Which way is best?

Of course, it always depends on your situation, and people have views and opinions that are all over the place. I’ll give you my opinion and try to accurately represent all viewpoints, but this is just my opinion, so feel free to disagree with me.

Estimating in actual time (hours, days, etc.)

Pros:

  • Estimating in hours makes sense to a lot of people, and they’re used to doing it.
  • If you’re on a project and the team understands the application, the business, and the subject matter very well, you might be able to accurately estimate how long something will take (especially if you can break it down into small tickets).
  • Works well when you can have the people who are going to do the work do the estimating. (This works best when you can estimate tickets shortly before you’re going to work on them so that you know who will be working on them.)

Cons:

  • Estimates can vary from developer to developer. One developer who has been on the team for awhile and works quickly might estimate something at 4 hours, but a slower developer who hasn’t been on the team for awhile might estimate 16 hours. Both estimates are correct (for that person). This is OK, but if you don’t know who is going to be doing the work and the 16 hour developer inherits the 4 hour estimate, you’re going to have a problem.
  • Doesn’t work well if you don’t know enough about the application, the business, or the subject matter, which makes it really hard to come up with an estimate in actual time that has any chance of being accurate.
  • If you track velocity over time, it should be relatively consistent in terms of hours of work completed, but this won’t show if the team is getting faster (or slower) over time because the team’s estimates of a certain type of ticket will decrease over time. If you estimate in story points, a certain type of ticket will always have the same point value and you will see an increase in velocity over time.

Estimating in story points

Story points are arbitrary values that are given to a feature and then all other features are estimated relative to how difficult each task is to the previous tasks that have been assigned a specific story point value. People measure “points” differently depending on who you ask – some people say points are a measure of time/effort and others say that points are a measure of complexity. There’s no one right way, which is the point of this post.

One popular method is to use the Fibonacci sequence numbers as the point values that you can use in your estimates (e.g. 1,2,3,5,7,11,13,17,23). This makes it a little easier because you don’t have to agonize over whether something should be a 13 or a 14.

Pros:

  • Works really well if you are estimating a project and you don’t know much about the application, the business, the technology, or the subject matter. In these cases, estimating in hours is a complete stab in the dark, but it’s much easier to compare the effort or complexity of one feature vs. another. (This happens a lot when you work for a consulting company and your company wins a bid for an entire project.)
  • People aren’t very good at estimating in actual time, but they’re much better at estimating the size of a task relative to other tasks that have specified point values.
  • You might have one developer who would estimate a task at 4 hours and another developer who estimates the task at 16 hours. But both developers might estimate the task as 2 points because they’re measuring the task relative to other tasks.
  • Tracking velocity has more meaning. If the team gets faster over time and now a 2 point ticket takes 4 hours instead of 6 hours, you should see an increase in velocity over time, which is good for the team (especially if you’re trying to justify doing Agile in an environment that is new to Agile and is wondering if it’s worth it).

Cons:

  • It can be awkward to estimate in story points, especially for new people who don’t know how the points have been allocated in the past. Other people have a hard time thinking in terms of story points when estimating a ticket in hours might seem easy.
  • Team members and management tend to try to convert story points to hours, at which point people start to feel like maybe they should just estimate in hours anyway.
  • Since a story point is arbitrary, it can become really easy to game the system. For example, management wants the team to increase velocity. Suddenly what would be a 2 point ticket now gets estimated as 3 points! (I realize that you could game the system if you were using hours as well, but it’s a little harder to do with hours since hours aren’t an arbitrary measurement.)
  • Management at some point is going to ask for an estimate (read: commitment) where you have to specify a date when you need to be done, so you’re probably going to have to translate points to hours.

Counting tickets

Pros:

  • Estimating feels like a waste of time and the estimates are often wrong anyway. If the tickets are all small and relatively close in size, the differences in size all average out anyway so we can just count the number of tickets and it will come out close enough. (This, of course, is dependent on being able to break down the work into small tickets of about the same size, which is hard to do on some projects.)
  • No more estimation meetings!

Cons:

  • Doesn’t work well if you aren’t able to break down the work into really small tickets.

An alternative way to count tickets is to have a small number of sizes of tickets (e.g. small/medium/large). This is similar to estimating in story points, but it’s less granular. You still count tickets, but each ticket has a point value (for example, small = 1, medium = 2, large = 3).

No estimation

Pros:

  • Works well if you just work the tickets as they come to you and you don’t have to do long term planning (e.g. handling production support, ongoing maintenance).
  • Works well if a good portion of your work is not known up front and just comes to you when it needs to be done.

Cons:

  • Won’t work if you’re working on a project where management needs to know when it will be done.

More on story points

I often hear complaints from people that like story points. They say, “Management keeps trying to translate story points to hours!” My response to that is, what’s wrong with that? If you’re on a story point project, eventually you’ll have enough data to show that a 1 point ticket typically takes X hours on average, and so on. Isn’t that a good thing? Aren’t you better off if you’re able to translate story points to hours? Who wouldn’t want to have that knowledge?

This doesn’t mean that you can’t continue to estimate in story points, but remember, the whole point of estimating is ultimately to tell management or the business when you are going to get work done. There is still value in story points (more meaningful velocity charts, easier to estimate in some cases, etc.), but at some point the translation to hours is probably going to be necessary.

Use your brain

I find that people are very passionate about this topic, and the most passionate ones either think that you should always estimate in story points or never estimate in story points. I don’t like to use words like “always” or “never” because you can always find a situation where it makes sense to do things a certain way.

This is where you come in. You can read all of the books and blog posts that you want, but ultimately you need to use common sense and find the estimation method that works best for your team. There’s no harm is trying something and switching to something else later. The important thing is to do more of what works and less of what doesn’t.


Read the next post in this series, Data analysis.

March 3, 2015by Jon Kruger
Agile, Iteration Management

Iteration Management – Post #5 – Estimates

This post is a part of a series of posts about iteration management. If you want to start from the beginning, go here.

If you ask people what they think of estimates, they’ll probably tell you that “estimates are always wrong”. But at the same time, management is taking those “wrong” estimates and treating them as a commitment to get work done by a certain date.

In reality, I think both of those things are true. The problem is that they seem so contradictory to each other, and this is where many teams get into trouble.

Many of you probably feel that estimating is a waste of time. It doesn’t make sense that you have to spend time each week estimating tasks when you could be using those hours to get things done.

I would love to live in a world where I didn’t ever have to estimate anything and all I would have to worry about is what I’m working on now and maybe what I have to work on next. Some of you might work in that kind of environment (maybe you’re in a small shop). But most businesses need to know how much things are going to cost, if Team A can complete a project before a certain date because Team B is going to need the functionality in place, if it’s worth it to build custom software or buy something off the shelf, or which consulting company to choose for a project. That’s the nature of smart business.

Or think of it this way – if you were going to build an addition on your house, would you not get several estimates from multiple builders and use those estimates as a major factor in who you picked to do the work? You certainly wouldn’t pick someone who said, “I do good work, so I’ll do the best that I can and then I’ll let you know how much it costs in the end.”

The fact is that if we want to be professionals, we need to be able to give good estimates, and we need to accept the fact that management is really asking for a commitment when they ask for an estimate. The whole reason that we estimate, regardless of the methods we use to do it, is so that we can tell management or the business when are going to get work done. Fortunately there are some things that we can do to come up with better estimates.

Small tasks

It’s much easier to estimate smaller things than larger things. What’s easier to estimate – the distance between your house and the one 3 houses down or the distance between New York and Chicago? You probably wouldn’t get either exactly right, but the margin of error will probably be less on the smaller distance.

The same is true when we’re breaking down a piece of work that we want to estimate. I like to break things down into the smallest unit that makes sense. Now that’s a pretty vague statement, but it really does depend on the situation. Ideally I like to break things down into the smallest testable unit that makes sense. That means that the feature provides some amount of value to someone (the business, IT, the dev team, etc.) and it can be tested and moved to production (or ready to go to production). There are always exceptions though – sometimes the smallest testable unit I can get to is still a week of work for 2 people, so then I’ll break the development down into smaller pieces (e.g. UI layer, business layer code, write some stored proc that is going to take awhile, set up an environment, etc.). Those technical tickets won’t be testable by themselves, but I’ll also have an overarching ticket that represents the testable unit (which is made up of the smaller techincal tickets). This at least lets us estimate smaller things so that we can be more accurate and have a better sense of how the work is progressing.

I’m not going to tell you what the maximum size of a ticket should ideally be, because every project is different. I’ve been on some projects where most tickets are under 4 hours of dev work, and I’ve been on other projects where the estimates were in days or weeks. The goal is to get the functionality broken down into the smallest chunk that makes sense for you so that you can get the estimate to be as accurate as possible.

Story Points or Hours?

There was enough here for it’s own post.

Categorization of work

On our team, we estimate analysis, development, and testing. So what counts as what? How does you categorize time spent by a developer writing automated tests? When a QA person writes a test plan, is that analysis or testing? What about meetings where you’re talking about a feature?

You can come up with your own rules of thumb, but here are mine:

Analysis

  • Time spent doing business analysis (this one is obvious)
  • Technical design
  • Research into how something works, whether this is business-focused or technical
  • Time spent by team members in meetings discussing the feature (remember, 5 people in a 1 hour meeting = 5 hours)

Development

  • Coding, writing code, thinking about code, talking about the code, etc.
  • Writing automated tests (if your QA people are writing end-to-end automated tests without developer involvement, I might categorize time doing that as QA)

Testing

  • Manual testing
  • Test planning
  • Writing up bugs for a feature
  • Writing end-to-end tests (see my comment in the Development section)

Other stuff (I might want to track the amount of time spent on these things, but not at a feature level)

  • Team meetings not related to specific features (retrospectives, standups, iteration planning, other team meetings)
  • Project management

How your team categorizes specific things doesn’t really matter, what’s important is that everyone is consistent and does it the same way so that you can get good data. You might want to check with your management as well because certain activities are capitalizable (like development, technical design, and testing) and others are not (like analysis).

The people doing the work should be the ones doing the estimating

This sounds pretty straightforward, but it’s really important. Let’s say that you know a lot about your application and you can complete feature X in 4 hours. But someone else who hasn’t been on your team as long or maybe isn’t as fast as you might take 16 hours. It’s not fair for you to give the 4 hour estimate and then hand it over to the person who is going to complete it in 16 hours. Maybe in that case you let the person re-estimate it at 16 hours, but that could throw your planning off. (This is another good thing about story points – when you estimate the size of a feature relative to other features, both developers might give the same estimate even though one will take 4 times the hours to complete it.)

I’ve been on some projects where we estimated a good portion of the work up front (because we had to bid on the project). That’s fine, but we never re-estimated anything. That led to lots of situations where a developer got assigned a ticket that they didn’t estimate, and once they had been working the task for as many hours as were estimated and they weren’t done, they started freaking out because they felt like they were behind, and this is when the sloppy code practices start happening. This happened because the people doing the work didn’t get a chance to give an estimate. If I give an estimate and I don’t finish it in time, then that’s on me, and I know it, so I don’t have any room to complain.

Nothing is more demoralizing than having someone else commit you to an estimate that you don’t feel is realistic. This just makes you feel angry, unmotivated, and unempowered. But if I make an estimate, then I’m a lot more likely to want to meet the estimate, even if it turns out that it’s going to take longer than I originally predicted.

Anything can be broken down

Any amount of work, no matter how complex, can be broken down into small, manageable tasks. The most complicated project is nothing more than a collection of simple tasks. The trick, of course, is identifying those simple tasks. But that scary project will become a lot less scary as you identify small units of work that need to be done. This exercise will also give you a better idea of all of the things you’re going to have to do, and you will be able to make better estimates on the small tasks.

This also applies to more nebulous roles like project management. Project managers are typically really busy and have to juggle numerous things at one time, but like anyone else, all of their work can be broken down, prioritized, tracked, and estimated. This will also free your mind because you have a system for keeping track of your work other than trying to remember everything in your mind (which is exhausting).

When to do the estimating

When the estimation happens depends on your team, your project, and how your team prefers to do it. I have a couple tips though.

Do the estimation as late as possible. It usually helps to have the work for the next iteration estimated so that you can do the capacity planning for the next iteration. You might have to estimate it earlier (so that you can plan out a release or bid on a project), but you might want to re-estimate that work when it gets closer to when you’re going to work on it in case the estimates have changed so that you can plan accurately.

Don’t have long estimation meetings. Some teams will have these meetings that last several hours long where the entire team goes through tickets and estimates them. I guarantee you that this will become everyone’s least favorite part of the week. Sometimes you might want to get everyone’s input on certain features, but for most things, you know who is going to do the work, so I would just let that person give their estimate so that you don’t have to tie up the whole team in mind-numbing meetings.

Remember the goal

Remember that however you estimate, the purpose is so that we can tell management or the business when are going to get work done. Use your intuition and come up with the best way that your team can estimate in order to meet this goal.


Read the next post in this series, Comparing estimation methods.

March 3, 2015by Jon Kruger
Page 1 of 212»

About Me

I am a technical leader and software developer in Columbus, OH. Find out more here...

I am a technical leader and software developer in Columbus, OH, currently working as a Senior Engineering Manager at Upstart. Find out more here...