Iteration Management – Post #10 – Metrics
This post is a part of a series of posts about iteration management. If you want to start from the beginning, go here.
In a previous post, I talked about data analysis and how you can use data to help you plan and estimate better. Now let’s talk about what specific things we can track and what we should do with it.
Types of metrics
I have to separate metrics into two categories – metrics that stay within the team and metrics that I share with others. The tricky thing about data is that data has no value on its own, the value is in the interpretation of the data. When I share data and metrics with people outside the team, I want to make sure that either I’m presenting the interpretation of the data or I’m presenting the data in a way that others will be able to interpret it correctly.
I can’t emphasize this enough. The worst thing that can happen is that you present raw data and people interpret it the wrong way. Also, if you present data without interpretation, people on your team will think about how others will interpret the data and change their behavior so that things will be interpreted in a way that makes them look good.
Interpretation, not just data
Management likes metrics. They realize that we can learn a lot from data and that it can give them an idea of how a project is going. They might not say it, but what they really want isn’t the data, it’s the interpretation (based on the data) that has real value for them.
A great example of this is burndown charts. Here’s a burndown chart from a project I was on:
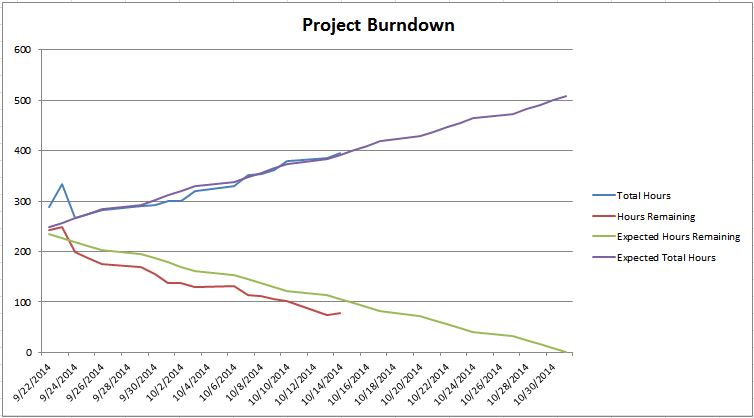
You can take two very different interpretations from this burndown:
1) The project is ahead of schedule and everything is OK
2) The project is at risk because we aren’t that far ahead of schedule and things have been going surprisingly smooth, and as soon as we run into any hiccups, we might not be done in time
The problem is that I presented data without interpretation and allowed it be interpreted by management. I find that managers can tend to be overly optimistic with their interpretation of data (especially when it comes to timelines). But there are things that I knew about the project that either weren’t reflected on the burndown or weren’t very clear:
- We were only about 20 hours ahead of schedule, which for this 2 person team equated to about 2 days.
- The timeline on this project was somewhat optimistic, with the assumption that we would try to control scope increases as much as possible, but on past projects we had run into unavoidable scope increases. This project hadn’t had any of those hiccups yet, but the fact that that hadn’t happened was unexpected.
As you can guess, management went with interpretation #1, while I felt the truth was interpretation #2. The problem was that I didn’t understand how they would interpret the data and I didn’t present it correctly.
How would I do this differently? Well, I’ll get more into burndowns in a later post. But I would include my interpretation along with the burndown, even if it’s something as simple as a red/yellow/green indicator to let them know how I feel about the project, risks/problems we might be having, or even just a conversation about how I feel about things.
Internal metrics
Internal metrics are things that I’m going to track to help me estimate and plan for future iterations, but I’m not necessarily going to publish this information for anyone to see (or maybe I just share it with the team, but not outside the team).
As far as internal metrics, what kind of stuff do I track? Well, it depends on the team and the situation, but here are some things:
- Estimates vs. actuals at the feature level (you can do this whether you estimate in hours or story points)
- Points/hours planned for vs. points/hours completed in an iteration
- Points/hours completed in an iteration (velocity)
- How long it takes for a work item to get from the time the business tells us to work on it to the time that it’s ready to go to production (cycle time – I say “ready to go to production” because sometimes you have the work completed, but you don’t send it to production immediately for various reasons)
- Work that comes into the iteration after the iteration starts
- How much work gets pushed out of the iteration
- Number of hours worked over 40 hours per week
- Percentage of time spent on analysis, development, testing, and everything else
- User happiness (this one obviously going to be backed up with data necessarily, but if the users aren’t happy, I don’t know that we’re succeeding)
You can collect all of this data, but the value is in how you interpret it, of course!
Velocity
A popular metric is velocity, but I’ve found that in order to be able to infer anything from the velocity data, I need to collect the data over a long period of time where almost everything in the work environment is consistent. That means that the team members don’t change, people don’t take long vacations, the team is doing similar kinds of work over that time period, and any number of things that are often very difficult to control (not to mention that the team might try to game the system to make the velocity numbers look good). Also, I don’t care about velocity as much as I care about capacity, or how much work we can get done in an iteration.
I’ve started taking a different approach to calculating capacity. Instead of using velocity (which in my opinion isn’t statistically significant enough), I like to take a gut feel estimate of how much I think the team can get done (which can somewhat be based on velocity data). I will also make estimates for other metrics that are easier to calculate, and then when I see that those metrics are off, I will adjust the velocity estimate accordingly.
For example, all of these metrics are easy to calculate and affect velocity and capacity:
- Estimates vs. actuals at the feature level (you can do this whether you estimate in hours or story points)
- Work that comes into the iteration after the iteration starts (excluding even swaps of one feature for another) – for example, this could be bugs, production support, etc.
- Percentage of time spent on analysis, development, testing, and everything else
- Points/hours planned for vs. points/hours completed in an iteration
- Planned vacations, holidays, or other unusual events
If I see that my estimates for these data points are off, then I can adjust them accordingly and also adjust my capacity estimates up or down. Over time, my capacity estimates should get better and better as I learn more, and I’m basing the number off of data points that are easy to collect and aren’t affected by so many variables. So in a way, I’m calculating the velocity of the team by backing into it.
Again, I’ve categorized velocity as an internal metric. Velocity is too raw of a data point to share with management in my opinion, because then you open yourself up to them wondering why one iteration had lower velocity than another and that sort of thing. I’d rather share my capacity numbers (which are interpreted from data by me) with management so that we can plan for the iteration and future iterations. My interpreted capacity estimate is going to be more accurate, and by doing this I have much more control over the message that I’m sending to management about the project.
External metrics
I really don’t have anything to list here, because it all depends on what your management wants to see. The key is to ask them to give you the questions they want answered, and then you come up with a way to answer those questions. That might be in the form of a chart, bullet points with red/yellow/green categorization, a conversation, or whatever makes them feel comfortable. Either way, I want to find a way that will help them easily and accurately see the state of the project.
You have to very careful in what you publicize. Many people (and I’ve done this in the past) will post velocity charts on the wall for everyone to see. Some people might say that this could motivate the team to try and get things done faster. In my opinion, all this is going to do is distract the team from the goal of delivering quality, working software. Now they might try to game the system to produce more velocity, maybe at the expense of writing tests, having design discussions with the team, working with the users to get it right, etc. I would much rather motivate people by showing them how the project they’re working on is going to have a huge impact for the business or the user base. When someone comes to me and paints that picture, man, I want to get the project done tomorrow because I see the impact that it’s going to have.
Bad metrics
There are certain metrics that I try to avoid, and this includes anything that could potentially influence anyone on the team to change their goals away from what they should be. For example, avoid any metrics that measure and compare individual team members. I don’t even want people to know that I’m collecting this information, because they will assume that anything that you are collecting might be getting shared with management or people outside the team. I know that some developers on the team are faster than others, and if these people report to you, then you might want to compare their performance with others. But you have to be very careful about it. The worst thing you can have happen is that team members stop trying to help other people on the team and only focus on getting their work done. This does not create a healthy work environment at all.
Implied metrics
Just because you don’t post a chart with numbers doesn’t mean that something that you’re doing can’t be interpreted as implied metrics. I’ve seen this happen with agile card walls. For example:
- Does your card wall make it easy to compare developers’ productivity levels?
- Does your card wall incentivize developers just getting a ticket to QA vs. getting a ticket developed and tested?
Agile card walls offer up lots of raw data that can be interpreted. This is a really good thing and it’s the reason that we use them. But you have to careful about how people might interpret would they say. There’s nothing wrong with using some sort of method to show who is working on what, but everything that you interpret from what you see on the board should be about how the team is doing, not how individuals are doing. If the board incentivizes people to work as a team, then they’re more likely to do that. But if it incentivizes people to work for themselves, then that’s what they’ll do.
Metrics are tricky!
Collecting metrics is a difficult task, and often you have to walk the line between providing helpful, meaningful interpretations of data and giving people another way to get the wrong impression about the situation. This takes a lot of intuition and understanding of how the people around you think, work, and interpret situations. But if you can collect good metrics, they will start you down the path to predictable delivery.
Read the next post in this series, Burndown charts.